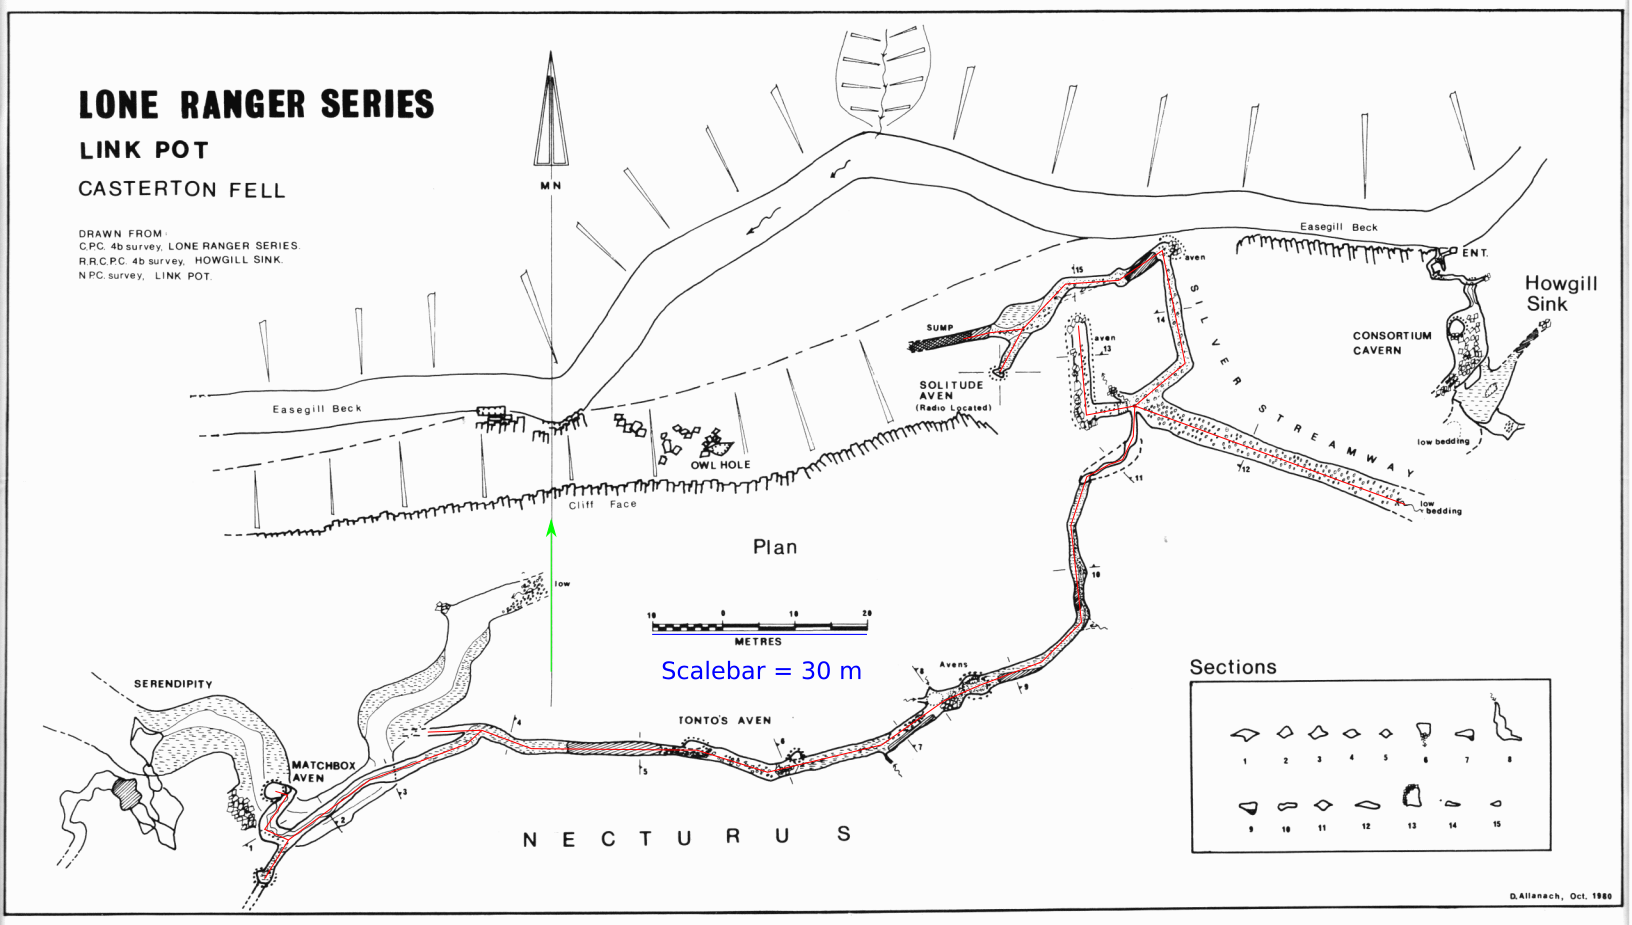
loneranger_cpcj6-2.png plus traced survey lines.Current version:
v3.0 - export plans, and / or separately elevations
Previous versions:
v2.1 - minor improvements
v2.0 - completely rewritten for Inkscape 1.0
v1.1 - for Inkscape 0.92
This plugin provides a mechanism to export inkscape line drawings as survex (.svx) input files. Use-cases include:
Some example surveys (Inkscape traced drawings) are also included.
This documentation (README) is also available in PDF and HTML.
Copy the files svx_export.py, svx_plan_export.inx and svx_elev_export.inx into your local Inkscape extension folder, namely:
~/.config/inkscape/extensions/ on unix / linux,%APPDATA%\inkscape\extensions\ on Windows.The extensions appear under “Extensions → Export” as “Export elevation to .svx file…” and “Export plan to .svx file…”.
The following conventions are observed:
Lines of any other color are ignored, as are other drawing objects. The default colors can be changed in the color tabs in the dialog box.
Exported (poly)lines are converted to traverses. If there is more than one traverse, each one is captured in a separate *begin and *end block in the survex file using Inkscape path name so that individual traverses can be matched up to the drawn paths. The survey as a whole is wrapped in a top level *begin and *end block with a name corresponding to the .svx file name following standard conventions.
Exported (poly)lines that are also dashed (or dotted) in any way can be optionally flagged as ‘splays’ by selecting this option in the export dialog box. This results in the corresponding traverse or traverses being wrapped in pairs of *flags splay and *flags not splay survex commands.
Survey stations that are closer than a given specification are assumed to be the same and given as an *equate at the start of the .svx file. The tolerance to select these (eg 0.2m) can be adjusted in the Parameters tab in the export dialogue box. Stations which feature in this *equate are automatically exported out of the underlying *begin and *end block by the appropriate *export commands.
Within each traverse survey legs are generated in the format
*data normal from to tape compass clino
where:
The from and to stations are integers generated automatically.
The tape length is generated using the scale line as reference, which will usually be traced over a scale bar in the survey. The true length that the scale line represents is specified in the Parameters tab in the export dialogue box.
The compass bearing is generated using the orientation line as reference, which for example will be traced over a North arrow in the survey (in the direction S to N; corresponding to bearing = 0.0 in the dialog box). If a North arrow is not used the true bearing represented by the orientation line should of course be specified in the Parameters tab in the export dialogue box.
The clino reading is set to zero.
Within each traverse survey legs are generated in the format
*data diving from to tape compass depthchange
where:
The from and to stations are integers generated automatically.
The tape length is generated using the scale line as reference, as described for plan views above.
The compass bearing is generated from the ‘facing’ direction set in the export dialog.
The depthchange is calculated also using the scale line as reference.
Usually the drawing will be made by tracing over a scannned image of a drawn-up survey. A typical workflow might be as follows:
In the subsequent dialog box, under the Parameters tab:
.svx file should be selected from one of the options;A box should appear reporting that the .svx file has been generated successfully, and indicating the number of (poly)lines exported. If the conversion encounters errors, they are similarly reported. A succesfully generated .svx file is immediately ready for processing by survex.
Notes:
The scale bar and (for plan views) orientation lines are picked up irrespective of the layer selection. Be careful not to get the colors of the orientation and scale bar lines mixed up! There’s no other way to tell them apart: the conversion step cannot know the difference, and no warning or error will be raised.
Be careful in setting the colors of the exported lines: they have to match exactly the export dialog, for example ‘nearly’ red lines will not get exported. As a check, for example, select all the lines that you expect should be exported and compare the count of these with the number of actually exported (poly)lines reported by the export dialog: the numbers should be the same.
Path names in Inkscape can be set by Object → Object properties…
If subsequently processing with survex generates the error ‘Survey not all connected to fixed stations’, then it is most likely a pair of supposedly coincident survey stations are not close enough together. To diagnose this:
.svx file processes properly;.svx file in a text editor and examine the list of *equate commands to see which stations were too far apart;It is suggested that magnetic N not be corrected for using the ‘bearing’ or ‘facing direction’ settings in the Parameters tab. Instead one can add a *calibrate declination line by hand to the top of the survex file, where the angle is positive for declination W. The NOAA website can be consulted to obtain declination data for a given location and year. Alternatively (and better) the declination can be corrected automatically using *cs commands and a *declination auto command (with a *date). The design choice to export legs as tape and compass readings, rather than as cartesian changes in easting and northing, was made precisely to accommodate this.
Depth information can be added to a plan view by hand editing the .svx file. A convenient way to do this is to change the survey data type to *data cylpolar from to tape compass depthchange. Note that the cylpolar style is very similar to a diving survey, used for the elevation export, except that in a cylpolar survay the tape is always measured horizontally rather than along the slope of the leg, so it is the cylpolar style we want here. The final column (which originally contained zero clino entries) can be edited to reflect the depth change between survey stations, whilst preserving the tape and compass entries which are presumably correct if taken from a drawn-up survey in plan view.
A large survey can be dealt with by partitioning the (poly)lines into different, named layers, keeping the same scale bar and orientation line, but generating a different survex files for each named layer. These survex files can be stitched together using a master file as illustrated below. Some hand editing has to be done to match up the corresponding stations in the different survey data files and it may be necessary to export these stations through the *begin and *end blocks in each file.
To make it clear what distance the line used for the scale bar represents, perhaps after a units conversion, I often find it convenient to add a note in the form of a text block to the Inkscape .svg file as in the examples below. In a similar vein one can add an arrow to the end of the orientation line to affirm the direction, also done in the examples below. This doesn’t affect the conversion.

loneranger_cpcj6-2.png plus traced survey lines.The file loneranger_cpcj6-2.svg traces over a plan view survey of the Lone Ranger series in Link Pot (Easegill) where the PNG image (loneranger_cpcj6-2.png) – originally published in CPC Journal 6(2) – is taken from CaveMaps. The scale line end-end distance is 30 m, so ‘Length of scale line (in m)’ in the Parameters tab should be set to 30.0.
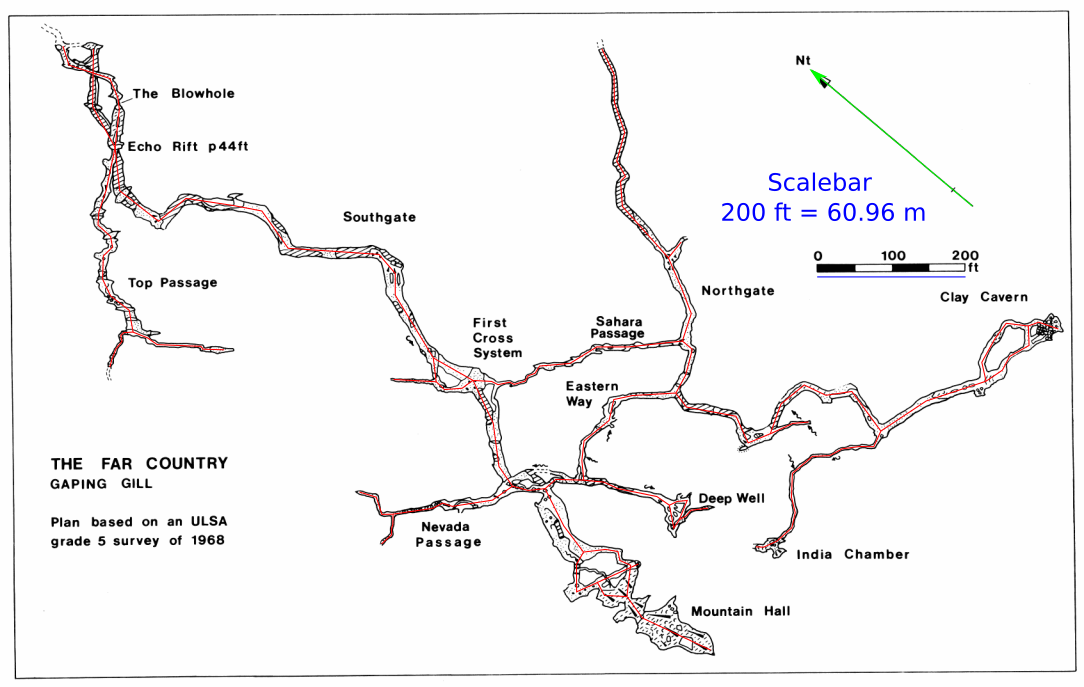
far_country_ulsaj89.png plus traced survey lines.Similarly, farcountry_ulsaj89.svg traces over a plan view survey of Far Country in Gaping Gill where the PNG image (farcountry_ulsaj89.png) – originally published in the ULSA ‘89 Journal – is likewise taken from CaveMaps. In this case the scale line end-end distance is 200 ft, so the ’Length of scale line (in m)’ in the Parameters tab would be set to 60.96. To get an idea of the work involved here, the generated Survex file contains 176 survey stations, joined by 180 legs, with a total length of around 1.5km of passage: it took less than 30 mins of drawing in Inkscape to do.
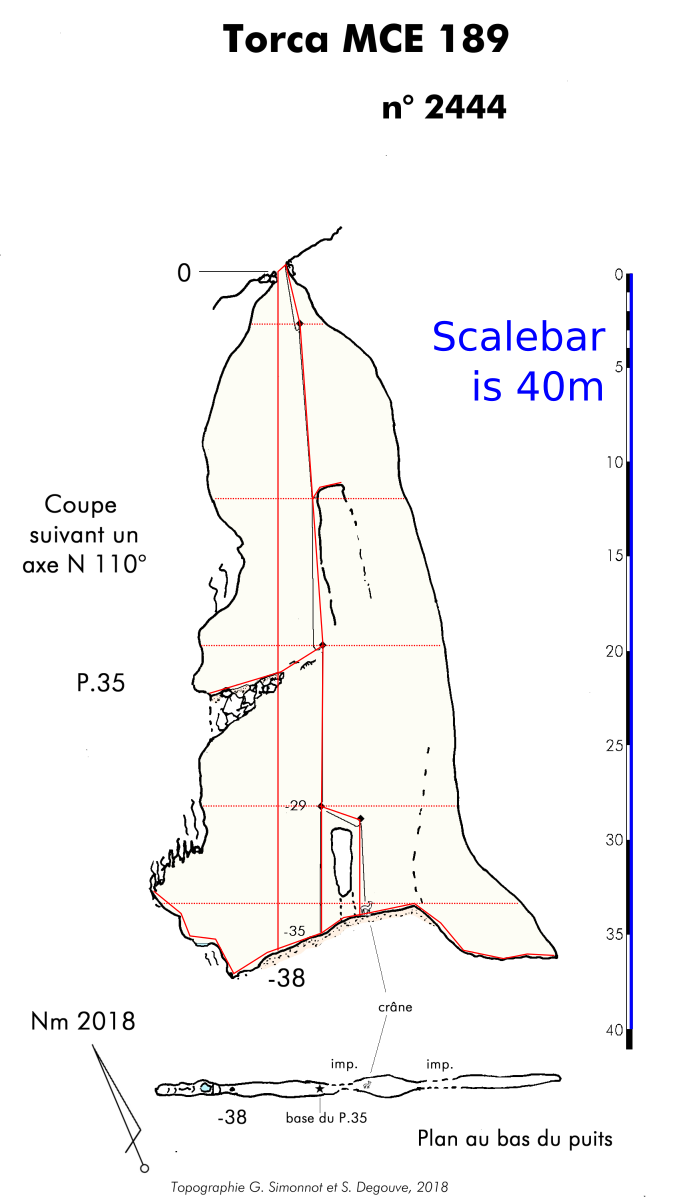
0189-2444-elev.jpg plus traced survey lines.Finally, 0189-2444-elev.svg traces over a French elevation of site 0189 in Matienzo. Here the ‘facing’ direction is set to 20° to correspond to the ‘Coupe suivant un axe N 110°’ and the (magnetic) north arrow shown on the survey. Note also the use of dotted lines here, which can be exported as splays.
The loneranger.svg tracing can also be used to illustrate the use of named Inkscape layers to break a survey into smaller pieces. The section from Matchbox aven to Tonto aven has been placed in a layer named matchbox, and the remaining passage beyond Tonto aven in a layer named silverstream. Thus the survex files matchbox.svx and silverstream.svx can be generated by exporting twice, using the option in the Parameters tab in the export dialogue to restrict export to each of these named layers in turn, taking the .svx file names from the selected layer name. These survex files can each be processed to a .3d file individually but to stitch them together we note that station path4288.8 in matchbox.svx should equate to station path4290.0 in silverstream.svx. Hence the following short survex file will do the job:
*include matchbox
*include silverstream
*equate matchbox.path4288.8 silverstream.path4290.0
As it stands this doesn’t quite work because we have not yet exported these stations from the underlying survex blocks. This has to be done by hand: in matchbox.svx, add station 8 to the list of stations exported from the *begin path4288 block and add *export path4288.8 just below the top level *begin matchbox statement (both are needed, as stations must be exported from each layer in turn). Similarly in silverstream.svx add station 0 to the list of stations exported from the *begin path4290 block and add *export path4290.0 just below the top level *begin silverstream. Then one should be able to process the above survex file to a combined .3d file.
Georeferencing refers to assigning a co-ordinate system to a map, in this case for example to a scanned hard copy of a survey. The actual steps require identifying so-called Ground Control Points (GCPs), which are identifiable features on the map for which actual co-ordinates are known. If the survey has a grid, or multiple entrances, these can be used. Frequently though the survey may only have one entrance, and just a scale bar and North arrow. In this case one can use the survex export plugin to generate co-ordinates for additional GCPs in the cave. To do this one can either trace over the passages and export the survex file, or more simply trace a fake centerline which simply connects the extra GCPs to the entrance. Check the generated .svx file can be processed, and then add a *fix command to fix the entrance GCP to the known co-ordinates. Processing this file allows you to extract the co-ordinates of the GCPs.
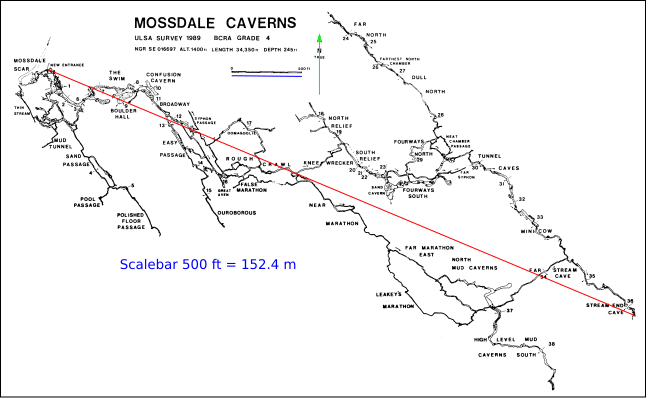
mossdale_ulsaj89.png plus artifical survey lines.For example suppose one wanted to georeference the ULSA 1989 Mossdale survey, which is included here as mossdale_ulsaj89.png. The original of this was downloaded from CaveMaps. This version has some material cropped out and has been reduced to a binary (2-color) image. The image is imported into inkscape and the scale bar (500ft = 152.4m) and North arrow traced (conveniently, the survey uses true North, so magnetic declination need not be corrected). To georeference, the simplest approach is to add a single line connecting the entrance to a distant identifiable feature in the cave, for example the small chamber shown at the end of the Stream End Cave passage. This line will be exported as the survex centerline and the two stations will be our GCPs. The resulting inkscape drawing is included here as mossdale_ulsaj89.svg. The exported survex file, modified as described below, is mossdale_ulsaj89.svx.
We now need to establish the co-ordinates of the entrance, as the first GCP. To do this one can of course make a site visit with a GPS, or perhaps more conveniently make a virtual site visit using MagicMap website and use the ‘Where am I?’ option to find the entrance is at (E, N) = (401667, 469779). This is the full 12-figure National Grid Reference (NGR). The 6-figure NGR SE 016697 given on the survey is correct of course, but as it locates the entrance only to within a 100m square it’s not really accurate enough.
These entrance co-ordinates are added to the survex file together with a a couple of *cs commands to georeference the same: choosing here to *fix the entrance using a 10-figure NGR in the Ordnance Survey SE square, and specifying the output co-ordinate reference system (CRS) to be EPSG:7405 (British National Grid with ODN altitude) for the fully numeric NGR. This may seem overkill but it gets the CRS meta-data into the .3d file in a form suitable for onward processing. Also I have adopted the convention of equating the entrance to a new station named entrance and fixing that. Finally, the entrance altitude (1400ft = 425m) has been added, although irrelevant for present purposes.
Thus the final file (mossdale_ulsaj89.svx) contains
*cs OSGB:SE
*cs out EPSG:7405

*fix entrance 01667 69779 425
*entrance entrance
*equate entrance mossdale_ulsaj89.0

*begin mossdale_ulsaj89

*data normal from to tape compass clino

0   1   1383.460  112.7 0

*end mossdale_ulsaj89
Note there is no inner *begin and *end for the path as only one path is exported. Also it doesn’t seem necessary to export the station out of the *begin / *end block.
On processing by cavern and 3dtopos the result is
( Easting, Northing, Altitude )
(401667.00, 469779.00,   425.00 ) entrance
(401667.00, 469779.00,   425.00 ) mossdale_ulsaj89.0
(402943.29, 469245.11,   425.00 ) mossdale_ulsaj89.1
(saved as mossdale_ulsaj89.pos). The two entries give the co-ordinates of the GCPs in the EPSG:7405 CRS and we can now proceed to georeference the image file, using for example QGIS. The final result, here provided as mossdale_ulsaj89.tiff in GeoTIFF format, can be directly imported into a GIS platform such as QGIS, and superimposed on other mapping data, Google satellite imagery, or the Environment Agency LIDAR data where available, for example.
Since it is also georeferenced (by the *cs commands) the survex centreline data can also be imported into QGIS using a plugin to import survex .3d files. The combined result, superimposed on an Open Street Map background, is here:
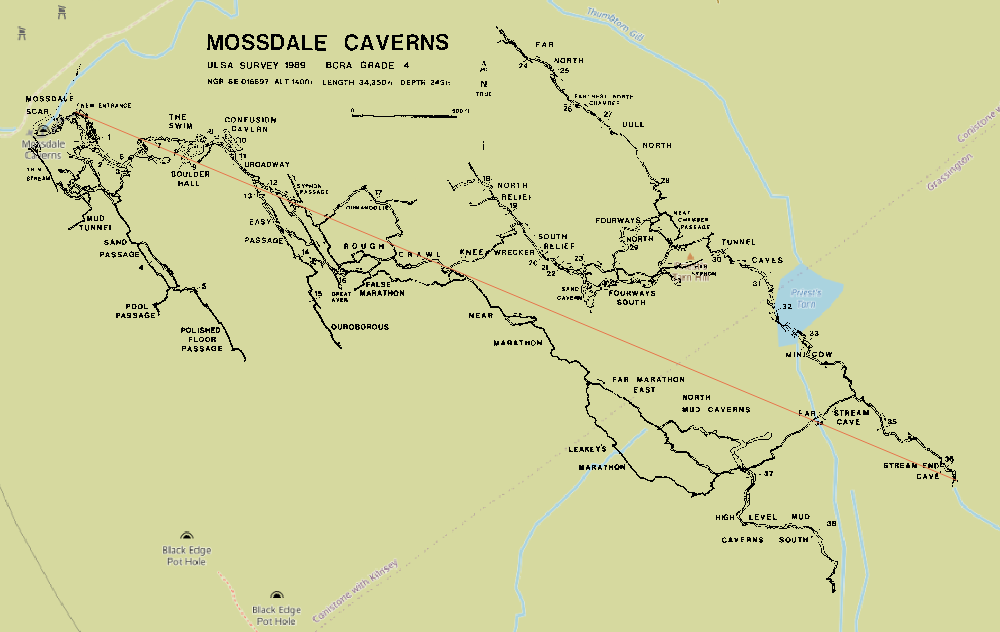
mossdale_ulsaj89.tiff plus artificial survey line and Open Street Map dataThis program is free software: you can redistribute it and/or modify it under the terms of the GNU General Public License as published by the Free Software Foundation, either version 3 of the License, or (at your option) any later version.
This program is distributed in the hope that it will be useful, but WITHOUT ANY WARRANTY; without even the implied warranty of MERCHANTABILITY or FITNESS FOR A PARTICULAR PURPOSE. See the GNU General Public License for more details.
You should have received a copy of the GNU General Public License along with this program. If not, see http://www.gnu.org/licenses/.
This program is copyright © 2015, 2020, 2021 Patrick B Warren.
Survey copyrights © are retained by original copyright holders.